Keeling Curve
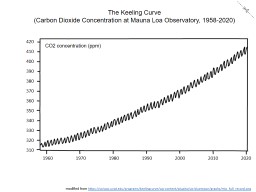
Graph of atmospheric CO2 concentration versus time (1958-2020)
Download PDF Download PPTX- Tags
- climate change
- Creator
- Kent Ratajeski, University of Kentucky, kent.ratajeski@uky.edu
- Source
- https://scripps.ucsd.edu/programs/keelingcurve/wp-content/plugins/sio-bluemoon/graphs/mlo_full_record.png
- Language
- Grade 2 (contracted) Braille
- Font
- Swell Braille, 24 pt, download from https://www.tsbvi.edu/download-braille-and-asl-specialty-fonts

This work is licensed under a Creative Commons Attribution 4.0 International License.